
|
|
General Information
The Republic of Croatia is slightly smaller in area than West Virginia, and has a population of 4.7 million. It is bordered to the north by by Slovenia, and Hungary, to the south by Bosnia-Herzegovina, to the east by Yugoslavia (Serbia), and to the west by the Adriatic Sea. There are 20 administrative regions (called 'zupanije') in Croatia, plus the city of Zagreb which is its own administrative region; these administrative regions are shown in Figure 1. The capital city, Zagreb, is located in the north central part of the country and has a population of about 770,000. The currency of Croatia, the kuna, has an exchange rate (as of December 2002) of 7.46 kuna to the U.S. dollar (i.e., one kuna equals $0.134). The gross domestic product (GDP) in 2001 was $36.1 billion (purchasing power parity).
Croatia, which had been part of the Federal Republic of Yugoslavia, declared its independence in 1991. Several years of friction with neighboring countries occurred, which has now been stabilized. Since 1999, Croatia has moved toward a more democratic market-oriented system.
Energy Policy and Regulation
The Croatian government plans to restructure, liberalize and privatize the energy sector. This restructuring is expected to emphasize compatibility with the European Union. The development and implementation of energy policy is the responsibility of the Ministry of the Economy. Currently, the energy sector is run by three state-owned companies:
Major energy reform legislation was passed by the Croatian parliament in July 2001. This included five new laws:
These laws took effect on January 1, 2002. Under these laws, the Regulatory Council began operation and is expected to issue regulations. Programs are being set up to restructure and privatize various state-owned companies in the energy sector. This is expected to lead to modernization of refineries and oil pipelines. Some new power plants are expected to be built and the transmission and distribution network is expected to be improved.
Under the new reforms, electricity consumers who use over 40 gigawatt-hours (GWh) per year [note: one GWh equals one million kilowatt-hours (kWh)] will be allowed to buy electricity directly from suppliers and negotiate better prices. There are 15 large industrial electricity consumers who use over 40 GWh. It is expected that the size requirement will eventually be reduced over time and eventually all consumers will be allowed to buy competitively.
Energy Summary
Because of its limited energy resources, Croatia is heavily dependent on imported oil and gas. There are major oil and gas pipelines going through Croatia and additional pipelines are being proposed. Most of the natural gas is piped in via Slovenia.
Croatia's primary energy consumption is dominated by liquid fuels as shown in Table 1.
| Fuel | Consumption | % of Total |
| Liquid Fuels | 0.246 | 68.9 |
| Water (Hydroelectric) | 0.054 | 15.3 |
| Natural Gas | 0.036 | 10.1 |
| Coal | 0.015 | 4.2 |
| Fuel Wood | 0.002 | 0.6 |
| Total | 0.353 | 100.0 |
An historical summary of Croatia's Total Primary Energy Production (TPEP) and Consumption (TPEC) is shown in Table 2.
| 1992 | 1993 | 1994 | 1995 | 1996 | 1997 | 1998 | 1999 | 2000 | |
| TPEP | 0.20 | 0.21 | 0.22 | 0.21 | 0.22 | 0.19 | 0.19 | 0.19 | 0.18 |
| TPEC | 0.33 | 0.33 | 0.36 | 0.37 | 0.37 | 0.38 | 0.40 | 0.39 | 0.41 |
Oil
Exploration, Production,
and Consumption
The INA Group is the state-owned holding company
that controls Croatia's oil and gas exploration, production, transportation,
trading, refining, and retailing. INA, in turn, owns 38% of JAFTA, the oil
pipeline systems. INA's Crosco subsidiary provides oil drilling (including
directional drilling), well testing, stimulation, workover, cementing, and
logging services, and also supplies drilling mud and nitrogen. There are
indications that some parts of the INA Group may be restructured and privatized
as part of Croatia's effort to achieve compatibility with the EU.
The oil reserves in Croatia are located southeast of Zagreb, along the Hungarian border, and along the Adriatic Sea. INA-Naftaplin is the unit of the INA Group that does oil and gas exploration, development, production, and acquisition. They have 43 onshore oil fields, 30 onshore gas fields, and 5 offshore gas fields. They also operate 10 onshore geothermal fields. In addition to Croatia they also have shares in drilling blocks in Albania, Angola, Egypt, Russia, and Syria. INA-Naftaplin reported their proven reserves for the year 2000 as 112.8 million barrels of oil and 22.8 million barrels of condensate; their 2000 production was 17.246 million barrels of oil and condensate.
An historical summary of petroleum production and consumption in Croatia is shown in Table 3.
| 1992 | 1993 | 1994 | 1995 | 1996 | 1997 | 1998 | 1999 | 2000 | |
| Production (total)* | 42 | 43 | 46 | 40 | 36 | 37 | 38 | 32 | 29 |
| Production (Crude Oil only) | 36 | 36 | 39 | 32 | 30 | 29 | 31 | 25 | 23 |
| Consumption | 65 | 63 | 79 | 88 | 78 | 81 | 90 | 91 | 88 |
Refineries and Downstream Processing
INA
operates two refineries and two lubricant product plants.
INA owns 401 retail service stations in Croatia, 51 in Bosnia, and 5 in Slovenia. In addition, INA supplies gasoline and oil to over 200 service stations owned by others. In connection with this retail petroleum products business, INA owns and operates storage depots, railroad facilities, and oil tankers.
An historical summary of Croatia's output of refined petroleum products by fuel type is shown in Table 4.
| Refined Product | Production Rate | ||||||
| 1993 | 1994 | 1995 | 1996 | 1997 | 1998 | 1999 | |
| Motor Gasoline | 24 | 25 | 29 | 25 | 25 | 27 | 28 |
| Jet Fuel | 2 | 2 | 2 | 2 | 2 | 2 | 1 |
| Kerosene | 0 | 0 | 0 | 0 | 0 | 0 | 0 |
| Distillate Fuel Oil | 26 | 28 | 37 | 30 | 31 | 31 | 34 |
| Residual Fuel Oil | 32 | 32 | 34 | 26 | 28 | 27 | 31 |
| Liquefied Petroleum Gases | 5 | 5 | 6 | 5 | 8 | 6 | 7 |
| Lubricants | 0 | 0 | 0 | 0 | 0 | 0 | 0 |
| Other * | 12 | 17 | 23 | 19 | 12 | 18 | 17 |
| Total Output | 102 | 111 | 132 | 109 | 108 | 112 | 118 |
| Refinery Fuel and Loss | 4 | 4 | 5 | 4 | 4 | 4 | 5 |
Natural Gas
The reserves of gas in Croatia, like
those for crude oil, are located mainly in three parts of the country: southeast
of Zagreb, along the Hungarian border, and along the Adriatic Sea. INA-Naftaplin
has reported proven reserves of 784.8 billion cubic feet of natural gas and
natural gas production for that year of 58.568 billion cubic feet. Most of
Croatia's natural gas is imported from Slovenia via a pipeline. An historical
summary of natural gas production and consumption in Croatia is shown in
Table 5.
| 1992 | 1993 | 1994 | 1995 | 1996 | 1997 | 1998 | 1999 | 2000 | |
| Production | 0.06 | 0.07 | 0.06 | 0.07 | 0.06 | 0.06 | 0.06 | 0.05 | 0.06 |
| Consumption | 0.096 | 0.104 | 0.091 | 0.082 | 0.088 | 0.099 | 0.094 | 0.094 | 0.098 |
Croatia has been exploring for natural gas with foreign firms. In 1996, Croatia's INA signed a production-sharing agreement with the Italian oil and gas company ENI (through Agip Croatia Bv) for joint development of gas fields in the northern Adriatic Ivana area. Ivana has estimated recoverable reserves of 275 billion cubic feet. ENI signed another agreement with INA in 1997 to develop the offshore area of Aiza-Laura on a 50/50 basis.
Under their 1997 agreement ENI would supply 3 billion cubic meters of natural gas to Croatia per year. This would require a major investment to upgrade Croatia's gas pipeline network. If the project is implemented, part of the gas would come from the Ivana gas field. ENI would supply the rest of the gas from other sources.
Coal| 1992 | 1993 | 1994 | 1995 | 1996 | 1997 | 1998 | 1999 | 2000 | |
| Production Anthracite Bituminous Lignite |
0.00 n/a 0.00 0.00 |
0.13 n/a 0.12 0.01 |
0.11 n/a 0.11 0.01 |
0.09 n/a 0.08 0.01 |
0.07 n/a 0.07 0.00 |
0.05 n/a 0.05 0.00 |
0.06 n/a 0.06 0.00 |
0.02 n/a 0.02 0.00 |
0.02 n/a 0.02 0.00 |
| Consumption | 0.66 | 0.85 | 0.57 | 0.30 | 0.43 | 0.49 | 0.40 | 0.42 | 1.02 |
The 486 megawatt (MWe) Zakucac hydroelectric plant is the largest power plant in Croatia, and is scheduled for renovation to improve its operability. A tender has been announced for the new 68.5 MWe Ombla hydroelectric plant proposed for a site on the Rijeka Dubrovacka river. Two additional hydropower plants have also been proposed, the 106 MWe Virje plant and the 42 MWe Lesce plant.
A summary of Croatia's Hydroelectric Power Plants is shown in Table 7.
Table 7: Hydroelectric Power Plants in Croatia
| Name | Owner/ Operator |
Capacity (MWe) |
Type | River |
| HPP Zakucac | HEP | 486 | Storage | Cetina |
| HPP Orlovac | HEP | 237 | Storage | Cetina |
| HPP Dubrovnik | HEP | 216 | Storage | n/a |
| HPP Senj | HEP | 216 | Storage | n/a |
| HPP Vinodol | HEP | 84 | Storage | n/a |
| HPP Kraljevac | HEP | 59.2 | Storage | Cetina |
| HPP Peruca | HEP | 41.6 | Storage | Cetina |
| HPP Dale | HEP | 40.8 | Storage | Cetina |
| HPP Sklope | HEP | 22.5 | Storage | n/a |
| RHP Velebit | HEP | 276/-240 | Reversible Storage | Zrmanja |
| PS Buško Plato | HEP | 11.3/-10.3 | Pumped Storage | n/a |
| PSPF Fuzine | HEP | 4/-4.2 | Pumped Storage | n/a |
| HPP Varazdin | HEP | 86 | Run of River | n/a |
| HPP Cakovec | HEP | 80.6 | Run of River | n/a |
| HPP Dubrava | HEP | 80.6 | Run of River | n/a |
| HPP Gojak | HEP | 48 | Run of River | n/a |
| HPP Rijeka | HEP | 36 | Run of River | n/a |
| HPP Miljacka | HEP | 24 | Run of River | n/a |
| HPP Golubic | HEP | 6.5 | Run of River | n/a |
| HPP Ozalj | HEP | 5 | Run of River | n/a |
| Krcic | Krcic | 4.5 | Run of River | n/a |
| Other HPPs | HEP | 15/-1.5 | Run of River | n/a |
Energy Transmission Infrastructure
Electricity Transmission
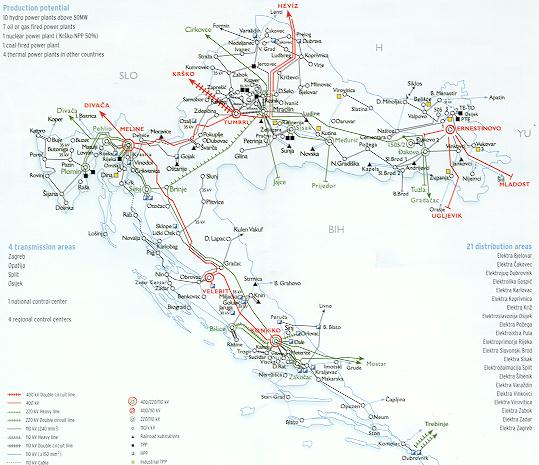
The Croatian electric
power transmission system is owned and operated by HEP. The electricity
distribution grid has three different voltages; there are 903 kilometers of
400-kV lines, 1,224 kilometers of 220-kV lines, and 4,760 kilometers of 110-kv
lines. There are also five 400 kilovolt (kV) substations, fifteen 220/110-kV
substations and 140 110-kV substations. A diagram of the major electricity
transmission lines in Croatia is shown in Figure 2.
Oil Pipelines
Most of the oil in Croatia
is imported via the Adria pipeline, which is run by the state-owned firm JANAF.
The Adria pipeline runs from the Adriatic port of Omisalji eastward to Sisak. At
Sisak, the Adria pipeline splits, with the northern part going to Hungary and
the eastern part going to Serbia. There are proposals to link the Adria pipeline
with the Druzhba (Friendship) pipeline that transports Russian oil to Hungary.
If this is implemented, the flow in the Adria pipeline would be reversed and the
port of Omisalji would start exporting oil instead of importing it. There is
also another proposal for an oil pipeline to Romania that would go through
Croatia and Serbia.
Croatia is planning to augment its oil and gas pipeline infrastructure. Several pipeline routes have been proposed, but it is still unclear what will actually be built. One proposal is to link the Adria oil pipeline with the Druzhba (Friendship) pipeline that transports Russian oil to Hungary. There is also a proposal for an oil pipeline link to Romania. This South-East European Line (SEEL) would transport 660,000 b/d from the Romanian port of Constanta on the Black Sea to the Italian port of Trieste on the Adriatic Sea. SEEL would be used mostly to provide oil to countries along the route. Several alternative routes are being considered for SEEL, with a southern route going through Serbia and Croatia on the way to Slovenia and Italy.
Gas
Pipelines
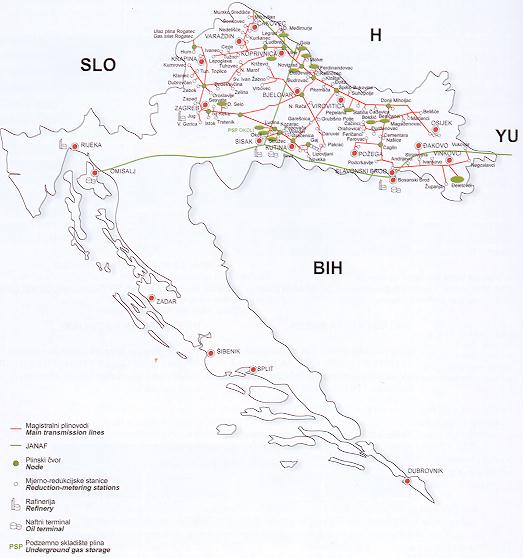
Natural gas pipelines in Croatia are run by Plinacro
Ltd., a unit of INA headquartered in Zagreb. Plinacro was established as a
company in January 2001 under its present name; previous names for this gas
transportation unit were SD-INA Natural Gas, INA-Trgovina, and INA-Naftaplin.
Plinacro has 1,741 kilometers of natural gas pipelines, including international
trunks and regional gas pipelines. Under the recent energy restructuring
initiatives, Plinacro will be planning for pipeline access for producers,
traders, and consumers according to publicly announced rules.
The main natural gas pipeline in Croatia goes to Slovenia. INA's 1997 deal with ENI, if implemented, would require major natural gas pipeline expansions to carry 3 billion cubic meters of gas to Croatia per year. In April 1999, Hungary's MOL and Germany's Ruhrgas proposed a natural gas pipeline system for the region of Baranja in eastern Croatia. A diagram of Croatia's gas transmission system is shown in Figure 3.
| 1992 | 1993 | 1994 | 1995 | 1996 | 1997 | 1998 | 1999 | 2000 | |
| Hydroelectric | 2.06 | 2.06 | 2.06 | 2.06 | 2.07 | 2.08 | 2.08 | 2.08 | 2.08 |
| Nuclear | n/a | n/a | n/a | n/a | n/a | n/a | n/a | n/a | n/a |
| Geothermal/Solar/ Wind/Biomass |
n/a | n/a | n/a | n/a | n/a | n/a | n/a | n/a | n/a |
| Conventional Thermal | 1.43 | 1.43 | 1.49 | 1.53 | 1.56 | 1.53 | 1.50 | 1.75 | 1.75 |
| Total Capacity | 3.49 | 3.49 | 3.55 | 3.59 | 3.63 | 3.60 | 3.58 | 3.82 | 3.82 |
Generation and Consumption
An historical
summary of electricity generation and consumption in Croatia is shown in
Table 9.
| 1992 | 1993 | 1994 | 1995 | 1996 | 1997 | 1998 | 1999 | 2000 | |
| Net Generation hydroelectric nuclear geo/solar/wind/biomass conventional thermal |
8.6 4.3 n/a n/a 4.3 |
9.0 4.3 n/a n/a 4.7 |
8.0 4.9 n/a n/a 3.1 |
8.6 5.2 n/a n/a 3.4 |
10.3 7.2 n/a n/a 3.1 |
9.4 5.2 n/a n/a 4.1 |
10.5 5.4 n/a n/a 5.1 |
11.8 6.5 n/a n/a 5.3 |
10.6 5.8 n/a n/a 4.7 |
| Net Consumption | 10.9 | 10.7 | 11.1 | 11.5 | 12.1 | 12.7 | 14.1 | 13.4 | 12.6 |
| Imports | 3.5 | 3.6 | 4.6 | 4.4 | 3.4 | 4.6 | 5.2 | 3.0 | 3.7 |
| Exports | 0.6 | 1.3 | 1.0 | 0.9 | 0.9 | 0.7 | 0.9 | 0.6 | 0.9 |
The OECD has reported that for the 1999-2000 period, the average household electricity price in Croatia was $0.075 per kWh. The average industrial electricity price was $0.053 per kWh.
Industry Overview
The electricity sector
is run by the Croatian Electricity Company, or Hrvatska Electropriveda (HEP), a
state-owned firm, which is responsible for generation, transmission and
distribution. HEP presently generates about 95% of Croatia's electricity, the
remainder coming from privately-owned industrial cogeneration power plants and
small hydroelectric facilities. HEP has three major oil-fired plants (Zagreb,
Sisak, and Rijeka) plus several small plants fired with coal and natural gas.
The Zagreb facility also has a 160 MWe gas-fired combined heat and power
(CHP) plant, which will be renovated by Parsons Power, Inc. A summary of the
thermal-electric power plants in Croatia is shown in Table 10.
Table 10: Thermal-Electric Power Plants in Croatia
| Name | Owner/Operator | Capacity (MWe) | Type/Fuel |
| TPP Plomin I | HEP | 98 | Coal |
| TPP Plomin II | HEP | 192 | Coal |
| TPP Rijeka | HEP | 303 | Fuel Oil |
| TPP Sisak | HEP | 396 | Fuel Oil/Natural Gas |
| TPP Zagreb I | HEP | 135 | Fuel Oil/Natural Gas |
| TPP Zagreb II | HEP | 83 | Fuel Oil/Natural Gas |
| TPP Osijek | HEP | 42 | Fuel Oil/Natural Gas |
| CCP Jertovec | HEP | 83 | Fuel Oil/Natural Gas |
| GTPP Osijek | HEP | 48 | Fuel Oil/Natural Gas |
| Emergency Diesel Plants (4) | HEP | 34.8 | Fuel Oil |
| Emergency Gas Plants (1) | HEP | 13.5 | Fuel Oil |
| Kutina Petrochemical | Kutina Petrochemical | 57 | Fuel Oil |
| Pula Uljanik | Pula Uljanik | 6.7 | Diesel Oil |
| Osijek Mill | Osijek Sugar Mill | 21.5 | n/a |
| Plaski Pulp Mill | Plaski Pulp Mill | 7 | n/a |
| Beli Manastir | Beli Manastir Sugar Mill | 6 | n/a |
| Durdevec Woodworks | Durdevac Woodworks | 1.8 | n/a |
Croatia plans to increase generating capacity, especially with natural gas as the fuel. Enron Europe had signed a 20-year agreement to supply electricity at a fixed price to HEP. Under this agreement Enron Europe had expected to build a 240 MWe natural gas combined cycle plant at Jertovec, north of Zagreb, which would have been the first independent power plant in Croatia. However, the agreement was annulled in mid-2000, when the Croatian government decided the terms of the contract were not favorable.
In the longer term, Croatia also plans to rehabilitate the 125 MWe coal-fired Plomin I power plant. Croatia also plans to complete the 210 MWe coal-fired Plomin II power plant. In February 2002, HEP participated in a Washington meeting with potential American investors in the Croatian energy sector sponsored by the U.S. Department of Commerce and the U.S. Trade and Development Agency. HEP announced the following five opportunities for independent or joint venture generation projects:
HEP also announced its interest in acquiring technology and software to upgrade the IT infrastructure of the power network. HEP anticipates that a portion of the company will be privatized; HEP encourages American companies to acquire stakes in the company when this occurs.
Croatia imports a considerable amount of power each year, and one potential source for the imported electricity is the 632 MWe Krško nuclear power plant, located on the border with Slovenia and jointly owned by the two countries. After several years of negotiations, Croatia and Slovenia appear to have finally resolved most financial and other issues concerning the plant. Croatia has not been using electricity from Krško in recent years. There is yet a possibility that Croatia may sell its share of the Krško plant.
Environmental Activities
Croatia is interested in the European Union and this may result in more attention to emissions. Croatia has been especially concerned about air pollution from metallurgical plants. Historical and projected anthropogenic sulfur dioxide (SO2), nitrogen oxide (NOx), carbon monoxide (CO), and non-methane volatile organic compound (NMVOCs) emissions in Croatia are shown in Table 11.
Table 11: Anthropogenic Air Emissions in Croatia, 1990-2010
(thousands
of metric tons per year)
| Pollutant | 1990 | 1991 | 1992 | 1993 | 1994 | 1995 | 1996 | 1997 | 1998 | 1999 | 2010 |
| SO2 | 180 | 108 | 106 | 113 | 89 | 70 | 66 | 80 | 90 | 91 | 70 |
| NOx | 88 | 65 | 56 | 59 | 66 | 66 | 69 | 73 | 76 | 72 | 87 |
| CO | 655 | 565 | 417 | 375 | 369 | 346 | 389 | 366 | 345 | 334 | 660 |
| NMVOCs | 105 | 87 | 64 | 69 | 75 | 74 | 82 | 80 | 79 | 73 | 90 |
Croatia is a party to several international environmental agreements including Air Pollution, Biodiversity, Climate Change, Hazardous Wastes, Marine Dumping, Ozone Layer Protection, Ship Pollution, and Wetlands. Croatia has signed but not ratified the agreements on Air Pollution -- Sulfur 94, Air Pollution -- Persistent Organic Pollutants, Climate Change -- Kyoto, and Desertification. An historical summary of carbon dioxide (CO2) emissions from fossil fuel use in Croatia is shown in Table 12.
| Component | 1992 | 1993 | 1994 | 1995 | 1996 | 1997 | 1998 | 1999 | 2000 |
| CO2 from coal | 0.32 | 0.43 | 0.28 | 0.07 | 0.24 | 0.30 | 0.25 | 0.25 | 0.65 |
| CO2 from natural gas | 1.45 | 1.56 | 1.37 | 1.24 | 1.33 | 1.49 | 1.42 | 1.42 | 1.47 |
| CO2 from petroleum | 2.67 | 2.71 | 3.16 | 3.64 | 3.14 | 3.24 | 3.68 | 3.74 | 3.62 |
| Total CO2 from all fossil fuels | 4.44 | 4.70 | 4.81 | 4.95 | 4.71 | 5.03 | 5.34 | 5.40 | 5.74 |
Privatization Status
Privatization activities in Croatia are not as advanced as with some of the other countries in Eastern Europe. Croatia has been trying to transfer state assets to the private sector on a gradual basis. Most of Croatia's small and medium-sized businesses have been privatized. The private sector now constitutes over 50% of the GDP. Oil, gas, and electric utilities have remained as state-owned businesses. However, there are now plans to sell some shares of HEP and JANAF to investors.
It is expected that HEP, the state-owned electric utility, could be restructured as early as June 2002. This could include separation of the generation, transmission, and distribution activities. Other activities, such as district heating, could also be separated. Eventually, 25% of HEP could be sold to investors. A separate system and market operations unit was set up within HEP in January 2002. However, this unit is not expected to be independent until 2003.
The Croatian government is also planning to attract foreign investors to JANAF, the oil pipeline company. Under current plans, 25% of JANAF could be sold to investors. JANAF is considering two major oil pipeline projects which would need investors:
A restructuring of INA is also being planned by the Croatian government, assisted by Pricewaterhouse Coopers and Deutsche Bank. Under this plan the two INA refineries could be privatized.
Economic Situation
The Croatian government is working to establish a stable economy in order to gain status as a viable newly independent Eastern European country. Croatia had strong growth for several years after independence. There was a downturn of the Croatian economy in 1999, but growth resumed in 2000. However, the unemployment rate has remained in double digits. An historical summary of Croatia's economic statistics is shown in Table 13.
| 1995 | 1996 | 1997 | 1998 | 1999 | 2000 | |
| GDP, billion $US | 18.8 | 19.9 | 20.1 | 21.6 | 20.0 | 19.0 |
| Growth, % | 6.8 | 5.9 | 6.8 | 2.5 | -0.9 | 3.7 |
| Inflation, % | 4.5 | 3.7 | 4.9 | 5.3 | 3.6 | 6.8 |
| Unemployment, % | 14.5 | 16.4 | 17.5 | 17.2 | 19.1 | 21.4 |
Trade and Investment
In 2001, Croatia had $4.5 billion of exports, which included machinery and transport equipment, miscellaneous manufactures, chemicals, food, raw materials, fuels and lubricants. There were $8.4 billion of imports in 2001, which included machinery and transport equipment, fuels and lubricants, food, chemicals, miscellaneous manufactures, and raw materials. Germany, Italy, and Slovenia were the major trading partners.
| For more information, please contact our Country Overview Project Manager: |
Richard
Lynch U.S. Department of Energy Office of Fossil Energy 1000 Independence Avenue Washington, D.C. 20585 USA telephone: 1-202-586-7316 |
 |
Return to Croatia
page |
| last updated
on December 2, 2002 | Comments On Our Web Site Are Appreciated! |