|
Library >> Renewable Energy Resource Maps >> Oceania >> Solar >> Australia Solar Energy in AustraliaSolar energy availability in Australia
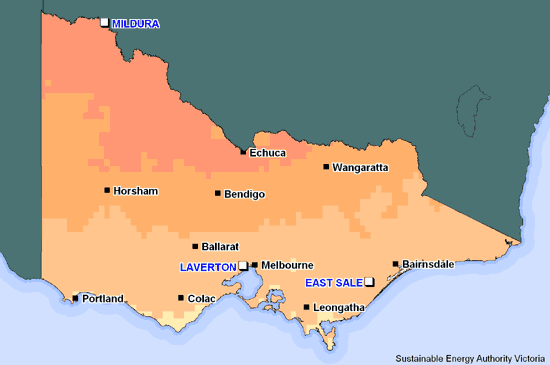
Victoria's average yearly global solar exposure
Interactive Renewable Energy Atlas - Australian Government http://www.environment.gov.au/apps/boobook/mapservlet?app=rea Interactive Renewable
Energy - Power Stations - Australian Government Mean Annual Solar Radiation Levels
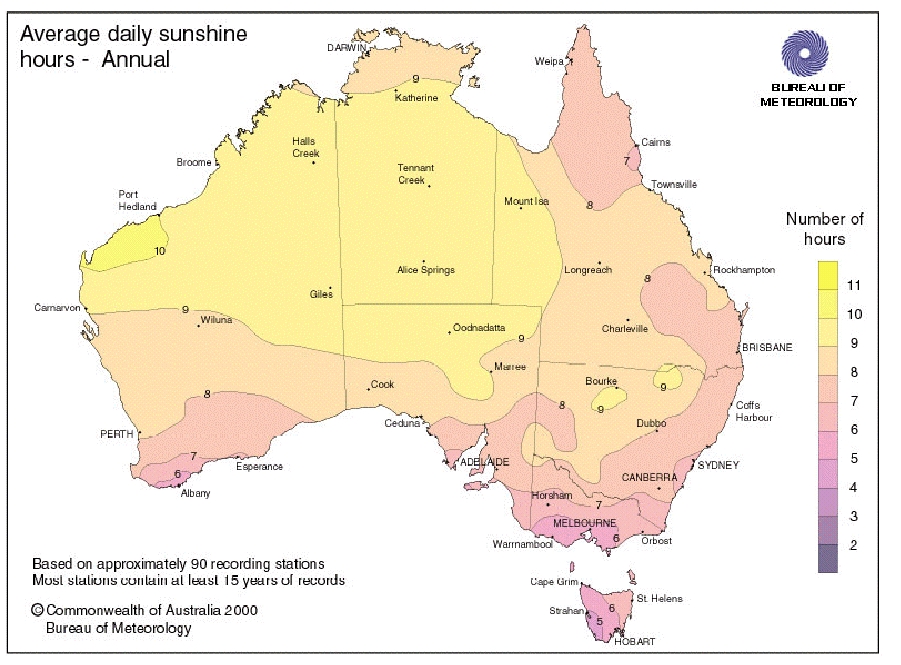
Annual solar radiation levels range from lowest (dark blue) to highest (red) across Australia. Source: http://www.energyfutures.qld.gov.au/solar.cfm Annual Average Daily Hours of Sun
The average amount of sunshine received by the various regions of Australia is mapped with the regions receiving the fewest number of hours represented by dark purple and the regions receiving the most number of hours shown by yellow. Source: http://www.green-trust.org/2000/solar/findsun.htm Daily Global Solar Exposure
This map demonstrates the amount of solar radiation Australia experienced on September 1, 2009. Source: http://www.bom.gov.au/sat/solrad.shtml
CountriesAustralia | Fiji | FS of Micronesia | Kiribati | Marshall Islands | Nauru | New Zealand | Palau | Samoa | Solomon Islands | Tonga | Tuvalu | Vanuatu Related GENI Resources
Links
| ||||||||||||||||||||
Email this page to a friend
If you speak another language fluently and you liked this page, make
a contribution by translating
it! For additional translations check out FreeTranslation.com
(Voor vertaling van Engels tot Nederlands)
(For oversettelse fra Engelsk til Norsk)
(Для дополнительных
переводов проверяют
FreeTranslation.com )


