Nearly every square meter of rooftop in Cambridge, Massachusetts, has
now been evaluated for its suitability to host solar panels.
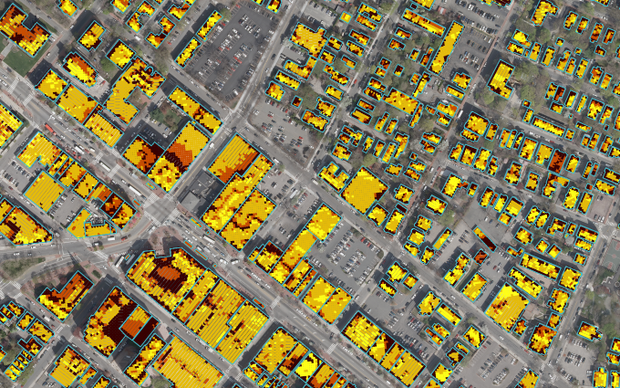
MIT Sustainable Design Lab/MoDe Studio
Within the borders of Cambridge, Massachusetts, are 17,000 rooftops, or
17,000 individual surfaces on which it might make sense one day to install
photovoltaic
cells. Of course, these roofs are not all equally fit for solar power.
Some of them have weird chimneys or sloping architecture or tree shade.
Some buildings
are oriented in the wrong direction (for the sun’s purposes, at least),
or they’re boxed in by even taller structures that block out natural
daylight.
From the sun’s point of view, all of this means that Cambridge looks
about like the aerial image above. The gold dots are the solar sweet spots,
the brown ones are more or less untouchable. The image comes from a new mapping
tool built by MIT’s Sustainable Design Lab and the Boston design firm
Modern Development Studio. They’ve mashed together some pretty remarkable
datasets about Cambridge to model the solar potential of just about every
square meter of rooftop space in the city (literally, each of those dots
represents one square meter). And the model they’ve developed could
potentially give us the same information about every surface on the planet.
"
When an owner uses the map, they get a very good evaluation of how good the
solar potential of their roof is,” says Christoph Reinhart, an MIT
associate professor working on the project. Modern Development Studio’s
web platform can even translate that solar potential into a financial cost,
a payback period, a carbon emissions reduction and equivalent calculations
for how many trees you’d have to plant or fewer miles you’d have
to drive to achieve the same effect. “But we’d like to now say,
what does it mean for the city?” Reinhart asks. “Where should
we support putting photovoltaics on roofs?”
This project assumes that we will one day be making decisions about where
to put this stuff at the community level rather than the household one. “Right
now it’s a bit about me, me, me,” Reinhart says, light-heartedly. “How
do I get the most money?”
This map illustrates that just because you want to be that guy on the block
with solar panels doesn’t mean your house is the best place to put
them.
MIT came up with all of this leveraging a couple of giant datasets with
fine-tuned algorithms. The model relies upon hourly solar radiation data
collected at nearby Logan International Airport (data that measures, in effect,
how much sun the city gets in this climate), as well as on Light Detection
and Ranging (LIDAR) data previously collected in an aerial flyover of the
city. LIDAR data, which captures how far each treetop or roof is from the
ground, is commonly used to make three-dimensional models of cities (or to
measure things like tree cover).
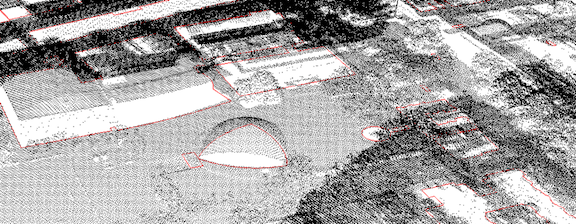
In the case of Cambridge, that LIDAR data contained 126 million individual
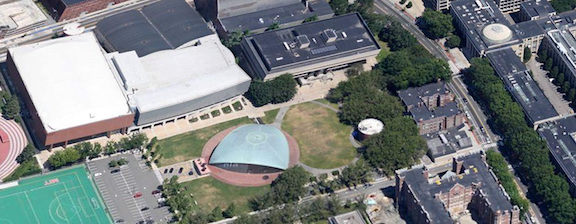
data points. To illustrate what this looks like, this is an aerial photo
of MIT’s campus and Kresge Auditorium:
This is what that same scene looks like with LIDAR data.
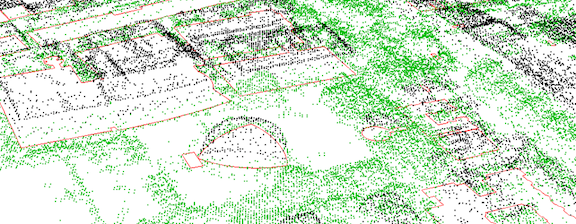
Here, MIT’s algorithm (which reduces those 126 million data points
to 9 million) simplifies the scene.
Using GIS floor print data, that same picture becomes a 3D model.
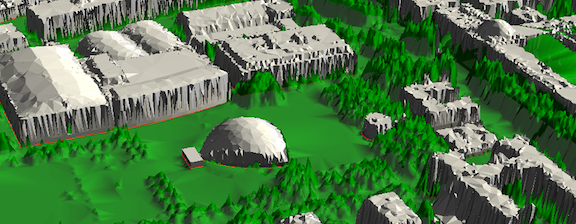
And now hourly solar radiation data is added to it as well.
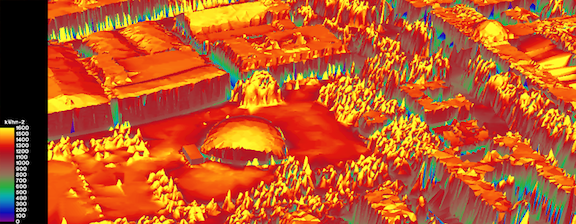
This is the end result, capturing this part of MIT’s campus on the
mapping tool.
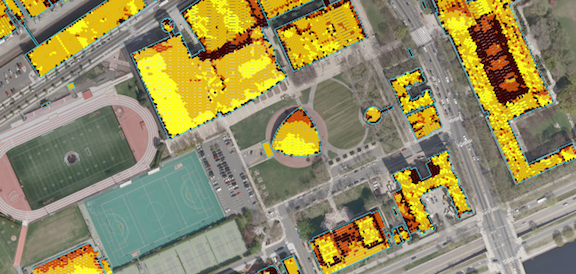
MIT shouldn’t waste time, in other words, trying to mount PV cells
on the northern tri-corner of Kresge Auditorium.
In all, Cambridge is particularly solar-friendly because most of its buildings
are of about the same height. A similar picture of Manhattan would look dramatically
different, with taller buildings crowding out the solar potential of smaller
ones. As Reinhart hopes, similar tools should come soon to other cities,
too.
All images courtesy of MIT's Sustainable Design Lab and Modern Development
Studio.


