 Map")
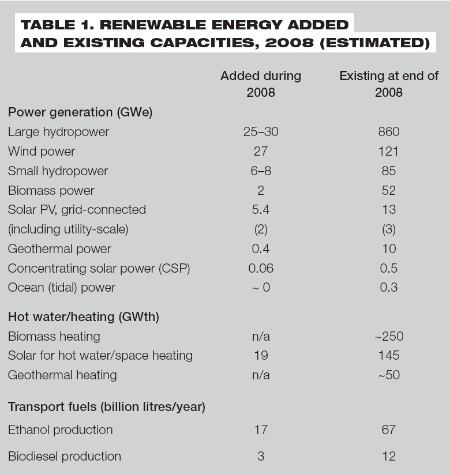
 Renewables Global Status Report 2009 UpdateSep 9, 2009 - Eric Martinot and Janet Sawin - Renewable Energy World.Com Future targets for renewable energy now exist in over 73 countries, up from 45 in 2005. Many such trends continue and are documented in this summary of the REN21 annual report. The year 2008 was the best yet for renewables. Even though the global economic downturn affected renewables in many ways starting in late 2008, the year was still one to remember. As Table 1, on page 22, shows, in just one year, the capacity of utility-scale solar photovoltaic (PV) plants (larger than 200 kW) tripled to 3 GW. All forms of grid-tied solar PV grew by 70%. Wind power grew by 29% and solar hot water increased by 15%. Annual ethanol and biodiesel production both expanded by 34%. Heat and power from biomass and geothermal sources continued to grow, and small hydro increased by 8%. The year 2008 also marked four years of dramatic gains across all technologies. Looking back, many can remember the milestone �Bonn Renewables 2004� conference, which brought together delegates from over 145 countries around the world to accelerate global action. That year was also the genesis of the REN21 Renewables Global Status Report.
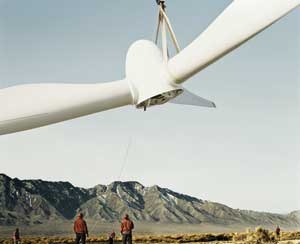
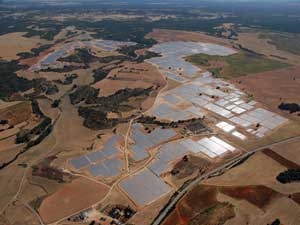
Since then, the four-year period 2005�2008 saw gains unprecedented in the history of renewables: grid-connected solar PV capacity increased six-fold to 13 GW; wind power capacity increased 250% to 121 GW, and total power capacity from new renewables increased 75% to 280 GW, including significant gains in small hydro, geothermal, and biomass power generation. Meanwhile, solar heating capacity doubled to 145 GWth; biodiesel production increased six-fold to 12 billion litres per year; ethanol production doubled to 67 billion litres per year; and annual renewable energy investment in new capacity increased four-fold, to reach US$120 billion (�85 billion). Perhaps one of the most remarkable milestones for 2008 was that renewables represented more than 50% of total added power capacity in both the United States and Europe. That is, more new renewables capacity was installed than new capacity for gas, coal, oil, and nuclear combined � although on a kWh basis, renewables� added contribution is less than capacity shares imply. By 2008, the top six countries by total amount of renewable power capacity were China (76 GW), the US (40 GW), Germany (34 GW), Spain (22 GW), India (13 GW), and Japan (8 GW). Capacity in developing countries grew to 119 GW, or 43% of the total. The year was also remarkable for the changes in country leadership of particular markets. Germany, the global wind power leader since the mid-1990s, ceded its position to the United States, which added 8.4 GW in one year to reach 25 GW installed. Germany was still close behind, at 24 GW installed, followed by Spain, China, and India. China moved from sixth to fourth place in 2008 as its wind power capacity doubled for the fifth year in a row. China added 6 GW and ended 2008 with more than 12 GW, achieving its 2010 target of 10 GW two years early. More than 80 countries around the world had commercial wind power installations by 2008, with Mongolia and Pakistan two of the most recent additions. Existing offshore wind capacity reached 1.5 GW in 2008, virtually all in Europe, with 360 MW added in 2008. The United Kingdom became the offshore wind power leader. In grid-connected solar PV, Spain became the clear market leader, with 2.6 GW of new capacity added, representing half of 2008 global additions of 5.4 GW, and a five-fold increase over the 550 MW added in Spain in 2007. However, Spain is not expected to repeat the 2008 performance, as its target was achieved and policy support has been scaled back. Spain�s unprecedented surge surpassed former PV leader Germany, which added 1.5 GW in 2008. Other leading markets were the United States (310 MW added), South Korea (200�270 MW), Japan (240 MW), and Italy (200�300 MW). Markets in Australia, Canada, China, France, and India also continued to grow. Globally, more than 16 GW of solar PV existed by the end of 2008, including off-grid installations. Spain also led a boom in utility-scale solar PV power plants (defined as larger than 200 kW), which emerged in large numbers around the world in 2008 � there were an estimated 1800 such plants existing, up from 1000 in 2007. The majority of utility-scale plants added in 2008 were in Spain, with others in the Czech Republic, France, Germany, Italy, Korea, Portugal, and the US. At 60 MW, the Spanish Olmedilla de Alarcon plant, completed in 2008, became the world�s largest solar PV plant. Several European countries also now lead a boom in building-integrated PV (BIPV), which is a small but rapidly growing segment of some markets. T he United States remained the world leader in geothermal power development, with more than 120 projects under development, representing at least 5 GW. Geothermal projects were under way in over 40 countries, with another 3 GW in the pipeline. Globally, geothermal power capacity reached over 10 GW in 2008. Leadership in concentrating solar thermal power plants (CSP) is now shared by the United States and Spain. Two new CSP plants came online in 2008 � the 50 MW Andasol-1 plant in Spain and a 5 MW demonstration plant in California � following three new plants in these two countries during 2006�2007. A number of additional projects are due to come on-line in 2009, including two more 50 MW plants in Spain and 20 MW of CSP integrated with a 450 MW natural gas combined-cycle plant in Morocco. The pipeline of projects under development or construction increased dramatically during 2008, to more than 8 GW by some estimates, with over 6 GW under development in the United States alone (in five different states). New projects are also under development in Abu Dhabi, Algeria, Egypt, Israel, Italy, Portugal, Spain, and Morocco. One important trend is that a growing number of these future CSP plants will include thermal storage to allow generation into the evening hours. The completed Andasol-1 plant in Spain, for example, has more than seven hours of full-load thermal storage capability.
In renewable heating technologies, solar hot water made impressive gains. China accounted for three-quarters of global added capacity in 2008 (14 GWth added in China out of 19 GWth globally). Solar hot water in Germany set record growth in 2008, with over 200,000 systems installed for an increase of 1.5 GWth in capacity. Spain also saw rapid growth, and the rest of Europe besides Germany added about 0.5 GWth of new capacity. Among developing countries, Brazil, India, Mexico, Morocco, Tunisia, and others saw an acceleration of solar hot water installations. In transport fuels, fuel ethanol production in Brazil ramped up dramatically in 2008, to 27 billion litres, after being fairly constant for a number of years. And for the first time ever, more than half of Brazil�s non-diesel vehicle fuel consumption came from ethanol. Notwithstanding Brazil�s achievement, the United States remained the leading ethanol producer, with 34 billion litres produced in 2008. Other countries producing fuel ethanol include Australia, Canada, China, Colombia, Costa Rica, Cuba, the Dominican Republic, France, Germany, India, Jamaica, Malawi, Poland, South Africa, Spain, Sweden, Thailand, and Zambia. The EU is responsible for about two-thirds of world biodiesel production, with Germany, France, Italy, and Spain the top EU producers. By the end of 2008, EU biodiesel production capacity reached 16 billion litres per year. Investment Flows Global investment flows to renewables increased markedly in 2008, while at the same time, country investment leadership changed hands. As recently as 2006, Germany and China were the global leaders in new capacity investment, with the United States far behind. However, due to a massive surge in wind power investment in the country, the US became the global leader in 2008, with $24 billion (�17 billion) invested, or some 20% of the global total. Spain, China, and Germany were not far behind the United States, all in the range of $15�19 billion (�11�13.5 billion). Spain moved up to second place by virtue of its large investments in solar PV. Brazil was fifth overall, at $5 billion (�3.5 billion), due to large investments in biofuels. Globally, approximate technology shares of the $120 billion (�85 billion) in new capacity investment were wind power (42%), solar PV (32%), biofuels (13%), biomass and geothermal power and heat (6%), solar hot water (6%), and small hydropower (5%). New capacity investment includes investment in new power plants, rooftop panels, and biofuels refineries (also called �asset finance and projects�), but does not include research and development funding or new manufacturing plant and equipment for the solar PV and wind industries. If these other categories of investment are included, total investment in 2008 likely exceeded $140 billion (�99 billion). [Note: A widely cited figure for 2008 by New Energy Finance is $155 billion (�110 billion) in clean energy investment, but that number includes further categories; for clarification, see Endnote 13 in the Renewables Global Status Report 2009 Update and the UNEP/SEFI report Global Trends in Sustainable Energy Investment 2009.] Other indicators of investment flows registered continued gains in 2008. For example, private equity investment and venture capital flows grew to $13.5 billion (�9.5 billion) in 2008, up from $9.8 billion (�6.9 billion) in 2007. And, development assistance for renewable investments in developing countries reached about $2 billion (�1.4 billion) in 2008, up from $500 million (�355 million) in 2004. Of course, investment flows have been affected by the financial crisis. Although the clean energy sector initially weathered the crisis better than many other sectors, renewable investment did experience a downturn after September 2008. According to New Energy Finance, total clean energy investment in the second half of 2008 was down 23% from the second half of 2007. Overall, renewable investments did not escape the general flight from risk. However, projects have continued to progress, particularly those supported by policies such as feed-in tariffs.
At the end of 2008 and in early 2009, partly in response to the financial crisis, a number of national governments announced plans to greatly increase public finance of renewables and other low-carbon or clean technologies. Many of these announcements were directed at economic stimulus and job creation, with millions of new �green jobs� targeted.
Industry Trends Renewable industries boomed during most of 2008, with big increases in manufacturing capacity and a diversification of locations. By August 2008, at least 160 publicly traded renewable energy companies each had a market capitalization over $100 million (�71 million). The total market capitalization of these companies, prior to the late-2008 market crash, was more than $240 billion (�170 billion). Of course, the market value of virtually all companies then took a big hit, and many subsequently closed plants, laid off workers, cut production, and revised expansion plans. It is too early to assess the full impacts, but anecdotal evidence suggests that many renewable energy companies have continued to do well in early 2009. The solar PV industry continued to be one of the world�s fastest-growing sectors in 2008. Global annual production increased six-fold between 2004 and 2008, reaching 6.9 GW. China usurped Japan to become the new world leader in PV cell production (1.8 GW, not counting Taiwan), with Germany moving up to second place (1.3 GW), followed by Japan (1.2 GW), Taiwan (0.9 GW), and the United States (0.4 GW). Although the US ranked fifth overall, it led the world in thin-film production (270 MW), followed by Malaysia (240 MW) and Germany (220 MW). Globally, annual thin-film production increased 120% in 2008, to reach 950 MW, as thin-film technologies met a larger share of demand. The global solar PV industry ended 2008 with over 8 GW of cell manufacturing capacity, including 1 GW of thin-film capacity. During 2008, the industry announced additional major production capacity expansions, many of them for thin-film technology, although many plans were called into question after the 2008 crash. Also during 2008, India emerged as an aspiring producer of solar PV, with state-level support for solar PV manufacturing in special economic zones. In the wind power industry, China saw the greatest growth in 2008, with several new companies producing turbines and many new component manufacturers. The industry appeared poised to start exporting turbines and had achieved a high level of domestic sourcing for most components. By the end of 2008, at least 15 Chinese companies were commercially producing turbines and several dozen more were producing components � the industry reportedly grew to more than 70 manufacturing companies. The Chinese wind sector appeared unaffected by the global economic crisis, according to industry observers, and some expect manufacturing capacity to approach 20 GW/year by 2010. New wind turbine manufacturing facilities opened in several other countries during 2008, notably in the US, where the share of domestically manufactured components rose from 30% in 2005 to 50% in 2007 and many new turbine and component manufacturing facilities came on line. Companies in at least two new developing countries, Egypt and Turkey, started to manufacture megawatt-scale wind turbines for the first time. In other industry developments during
2008: Targets for Renewable Energy
By early 2009, policy targets for renewable energy existed in at least 73 countries and states. This includes state/provincial-level targets in the United States and Canada, which have no national targets to date. In addition, there is an EU-wide target of 20% of final energy consumption by 2020 that was enacted in 2007. That EU-wide target was followed in 2008 by final confirmation of 2020 targets for all 27 individual EU member countries. Some EU countries also adopted additional or supplementary targets in 2008, such as Germany�s targets for 30% electricity and 14% heating by 2020. Also, an existing EU transport-sector target (10% share of transport energy by 2020) was modified to encompass biofuels, electric vehicles, and electric trains, with a credit multiplier of 2.5 for renewable electricity consumed by electric vehicles. Special provisions for biofuels sustainability were also adopted. Many policy targets were enacted or upgraded during 2008 in jurisdictions around the world. (For country-by-country target details, see the 2007 and 2009 editions of the Renewables Global Status Report.) At the national level, new targets were enacted or upgraded in Abu Dhabi/UAE, Albania, Australia, Bangladesh, Brazil, Cape Verde, France, India, Indonesia, Ireland, Israel, Jamaica, Kenya, Madagascar, Nicaragua, Pakistan, Russia, Rwanda, Samoa, South Korea, and Tunisia. At other levels, targets were enacted or upgraded in several states/provinces in the United States and Canada, Chinese Taipei (Taiwan), Scotland (UK), and Gujarat (India), among others. Although not strictly a target, China�s plan to go beyond its existing goal of 30 GW of wind power by 2020 is noteworthy. China is planning new large-scale �wind power bases� in six provinces/regions that could result in 100 GW of new wind capacity by 2020. According to one analysis, China�s 2007 renewable mandates for power generators � requiring 8% of capacity and 3% of generation by 2020 � also imply an additional 100 GW of non-hydro renewable capacity by 2020. During 2007�2008, a number of countries exceeded existing targets for 2010, including China (10 GW of wind capacity target), Germany (electricity target), Hungary (electricity target), and Spain (solar PV target). Policies To Promote Renewables By early 2009, at least 64 countries had some type of policy to promote renewable power generation. Feed-in tariffs are the most widely used policy, existing in at least 45 countries and 18 states/provinces/territories around the world. Feed-in tariffs were adopted at the national level in at least five countries for the first time in 2008 and early 2009, including Kenya, the Philippines, Poland, South Africa, and the Ukraine. Following its earlier feed-in policies developed in the 1990s, India also adopted new feed-in tariffs for solar PV and solar thermal power. Several more countries were engaged in developing feed-in policies, including Egypt, Israel, Japan, Nigeria, and the United Kingdom. At the state/provincial level, at least 10 jurisdictions adopted new feed-in tariffs in 2008 and early 2009. Several countries also revised or supplemented their feed-in laws. Common revisions included extending feed-in periods, modifying tariff levels, adjusting annual percentage decreases in tariffs, establishing or removing annual programme capacity caps, adding eligibility for (distributed) micro-generation (including small-scale wind power), and modifying administrative procedures. Other policy developments for 2008
and early 2009 include: Conclusion The integrated picture of global renewable energy markets, investment, industry, and policies presented here provides much for optimism about the future. Indeed, the modern renewable energy industry has been hailed by many analysts as a �guaranteed growth� sector, due to the global trends and drivers underlying its expansion during the past decade. Policy makers have reacted to rising concerns about climate change and energy security by creating more favourable policy and economic frameworks, while capital markets have provided ample finance. The recent growth of the sector has surpassed all predictions, even those made by the industry itself. Without a doubt, the renewable energy sector has felt the impact of the current economic crisis, but growth continues. The Renewables Global Status Report shows that the fundamental transition of the world�s energy markets is continuing. Eric Martinot is Senior Research Director of the Institute for Sustainable Energy Policies in Tokyo, research fellow of the Worldwatch Institute, and affiliate of the Tsinghua-BP Clean Energy Center of Tsinghua University. Janet Sawin is Senior Researcher and Director of the Energy and Climate Change Program of the Worldwatch Institute and research director/lead author for REN21. This article is based on the REN21 Renewables Global Status Report 2009 Update, written by lead authors Eric Martinot and Janet Sawin, and published in May 2009. Free downloads are available at www.ren21.net and www.martinot.info. The authors wish to thank the 150 researchers and contributors who have provided information since 2004, the German government for primary funding and the US government for supplemental funding. And recognition of the Worldwatch Institute is due for its leadership in producing the report since 2005. |
Email this page to a friend
If you speak another language fluently and you liked this page, make
a contribution by translating
it! For additional translations check out FreeTranslation.com
(Voor vertaling van Engels tot Nederlands)
(For oversettelse fra Engelsk til Norsk)
(Для дополнительных
переводов проверяют
FreeTranslation.com )