
Rebound:
US Photovoltaic Market Growth through 2010 Dec 15, 2009 - Larry Sherwood,
Anneke Hohl, Eric Paul and Jon Guice, PhD - renewableenergyworld.com
Recently, AltaTerra Research presented a national web conference on the American
solar market with Jon Guice, an expert on U.S. solar market entry, and Larry Sherwood,
author of the annual "U.S. Solar Market Trends" reports published by the Interstate
Renewable Energy Council (IREC). We believe the information shared—including
actual installation data collected from a wide variety of sources and locations
in a highly diverse and fragmented national market—to be the freshest, latest
authoritative look at the U.S. market, and we would like to share a few of the
highlights with you here.
In these highlights, we focus on the market for grid-connected
photovoltaics (PV) in the U.S. We recognize that the U.S. is not the dominant
market for PV in the worldwide marketplace and encourage interested readers to
look at world data to round out the information presented here for a complete
picture of the global market. Within the scope of the U.S. market for grid-connected
PV, the insights we provide here include actual data through 2008, estimates for
2009 and projections for 2010. Data Through 2008 The
data presented in this web conference come from Larry Sherwood’s ongoing
work with IREC, and are based on a wide variety of about 40 sources around the
country, including government sources and analysis of actual installations. Some
of these sources are publicly available, such as the California Solar Initiative
database, which is updated weekly. While anyone can access the data from these
public sources, it is a challenge to understand and compare the data due to differences
in reporting. For the purposes of the web conference, for example, all data
was converted to DC watts. Another challenge in analyzing the data for PV installations
is determining in which year the installation happened since most of the data
comes from incentive programs. We attribute installations to the year in which
payment was made. The installation of many projects near the end of the year makes
a big difference in how many installations are accounted for in each year.
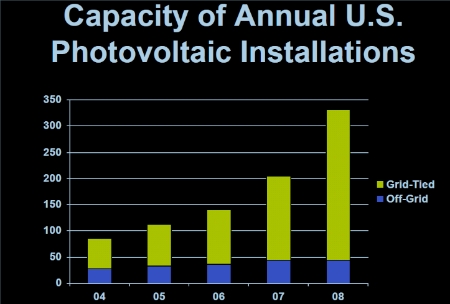
Chart
credit: IREC As shown in this chart, the total capacity of off-grid PV installations
in the U.S. has been growing at a modest rate over the past 5 years. The real
story is the growth that has been occurring in the grid-tied market. Prior to
5 years ago, off-grid installations accounted for more than half the market. In
2008 they accounted for only about 15% of the market. Projections
for 2009 and 2010 The chart below shows installed megawatt (MW)
capacity for grid-tied installations through 2009 and 2010 (estimated). The data
is broken down by residential, non-residential and utility installations. Residential
and non-residential installations are defined as on-site installations on the
customer side of the meter. In utility installations, the power goes into a bulk
power market and is resold by the utility to its customers. Utility installations
include fields of PV panels, and some instances of utility installations on customer
buildings. 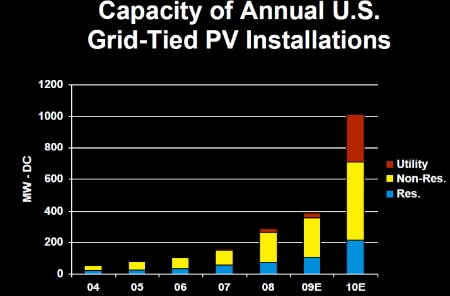
Chart
credit: IREC In 2008, the residential market was a little more than a fourth
of the total market. The non-residential, commercial and institutional market
was the largest portion, with most of the largest installations financed through
power purchase agreements (PPAs). In 2009, we do not expect much change in the
distribution of the market share between residential, non-residential and utility
installations. Despite the dire press about what is happening
in 2009, the reality is that 2009 has been a good year for installations in the
U.S. Based on available data for installations to-date, known installations that
are in the pipeline, and announced large projects that we expect to be completed
by end of year, we estimate a growth rate of 25-40% for 2009. This does not account
for projects that remain under construction at the turn of the year. While this
growth is slower than the past several years, in which we saw growth rates in
the 50-75% range, it is still growth, which is especially good in hard economic
times. In looking at individual incentive programs, every program is experiencing
healthy growth rates of 25-80%. In 2010, we expect growth rates for grid-tied
PV in the U.S. to accelerate up to and perhaps beyond the growth rates of previous
years. Module prices are decreasing, opening up new market opportunities. The
federal stimulus is also going to have a big impact. For example, the rules for
the cash grant program, which is being offered as an alternative to the federal
tax credit, were just announced in July, so most projects under that program will
not be installed until 2010. The utility-scale market is projected to grow to
300 MW by 2010. There are also a number of federal installations on the horizon,
with direct funding being provided for solar projects on government buildings.
In addition to other federal and state programs and the ongoing popularity of
incentive programs, all signs point to a good year in 2010. Overall, we anticipate
a U.S. grid-tied PV market on the order of 1 GW (1000 MW) in 2010. This
may leave some readers wondering why our expectations for 2009 and 2010 are lower
than most projections from other analysts—particularly those that are taking
positions in relation to publicly-traded stocks. Part of the answer is that the
information presented here is based on bottom-up analysis of the market, a much
more data-intensive approach than the top-down approach used by many stock analysts. For
further details, you can find the complete presentation and archived recording
from the web conference at AltaTerra Research's website. The full conference
included state-by-state market data, issues such as financing, module prices and
project size growth, trends and connections to solar thermal markets, and key
factors driving the market in 2010.

|