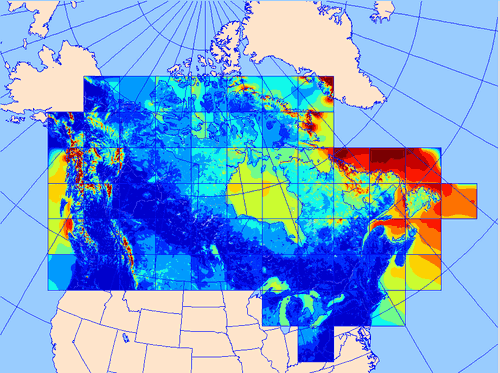
The map below shows the slicing of the Canadian
territory in 65 tiles on which numerical simulations
were performed. It displays an overview of the different
fields that were calculated: mean wind speed and
energy for three different heights, as well as three
geographic fields (roughness length, topography,
land/water mask).
http://www.windatlas.ca/en/maps.php